| Name | Last modified | Size | Description | |
|---|---|---|---|---|
| Parent Directory | - | |||
| PACS-S_redLeakHPDP_R..> | 2018-02-13 08:52 | 334K | ||
| PACS_redleak_banner.png | 2018-01-18 15:56 | 188K | ||
| observationList.txt | 2018-01-18 15:58 | 14K | ||
Elena Puga, ESAC PACS Instrument and Calibration Scientist
24th March 2017, v1
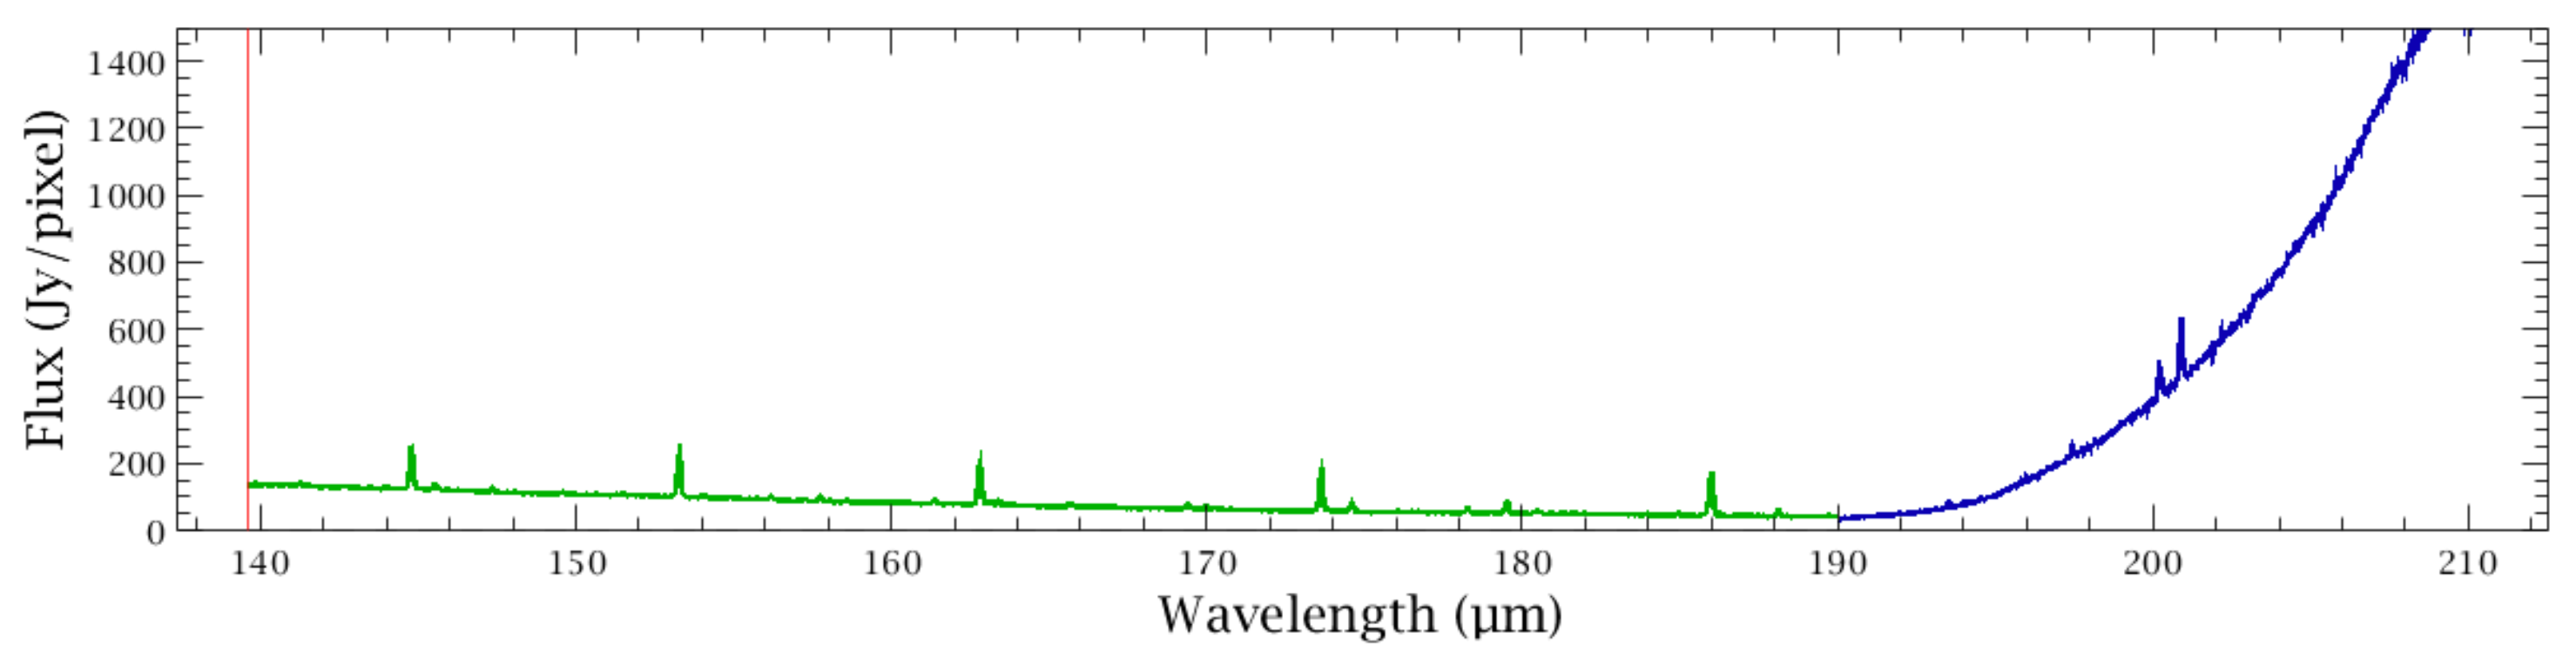
PACS Spectrometer observations with wavelengths longward of 190 μm are affected by spectral leakage, or order overlap. These spectral ranges – masked out by the standard processing generation (SPG) pipeline – have been processed with a non-standard calibration scheme for the chop-nod observations, and a dedicated relative spectral response function for the chop-nod and unchopped observations. These spectral cubes feature calibrated order 1 emission lines in the 190-206 μm range, while the continuum remains uncalibrated.
To disentangle order leakage from the native R1 band, measurements of the relative spectral response function (RSRF) in this wavelength range were obtained during the pre-launch test campaign with two different blackbody temperatures. The description of the construction method for the R1 RSRF is provided in the PACS Spectrometer Handbook.
The PACS Spectrometer SPG pipeline did not contemplate the order-leak processing, instead the spectral ranges above 190 μm was masked out and completely removed. Since the calibration of the red leak (>190 μm) requires use of the "calibration source" pipeline method, which is standard for unchopped observations but not chop-nod observations, and the R1 leak-corrected RSRF method, which is non-standard for all observing modes, it was deemed an “exotic” use of the pipeline. Therefore these ranges are provided as HPDPs instead.
There are 1353 standard PACS Spectrometer observations that include at least one spectral scan beyond 190 μm. The red-leak HPDP is comprised of line scans (prime range) fully in the leak range, range scans (prime and parallel ranges) fully or partly in the leak, and B2B and B3A SEDs. Since some ranges are only marginally longward of 190 μm, the final number of red leak HPDPs is 1331. The obsids are provided in the file observationList.txt.
These observations were reduced with HIPE versions 15.0.2868 and 15.0.3244, using PACS_CAL_77_0. An analogue of the SPG pipeline was used, using R1 RSRF calibration file FM v5, and masking out any spectral scan shortward of 190 μm. The spectral flatfielding applied to the range observations used splines with a knot separation of 2 μm, instead of the default 6 μm for R1.
The final products are standard level2 products in the red band for both chop-nod and unchopped observations. We do not provide the rebinned cube table. For each obsid/directory there is a postcard image, when available, and a number of subdirectories (containing cubes and tables) with the standard product name acronyms in capitals. These acronyms are observing-mode dependent and are described in the PACS Products Explained document. The possible directory names are HPS3DR, HPS3DRR, HPS3DPR, HPS3DIR, HPS3DDR, and HPS3DEQXR (X=P,I,D,R) for cubes, and HPSSPECR for the point-source table.
In the directories, the products are provided as compressed .fits files. We have used the standard naming convention:
hpacs<OBSID>_20hps3d<SUFFIX>r_redleak_<##>.fits.gz for cubeshpacs<OBSID>_20hpsspecr_redleak_<##>.fits.gz for point-source tableswhere OBSID is the observation identification number, SUFFIX is empty for the pacsCube and one of [R|P|I|D] for the rebinned, projected, interpolated and drizzled cubes, respectively, while ## is the slice number. Note that the slice number is not preceded by an s.
These data enable the access to the spectral range above 190 μm for 1331 observations and to emission-line calibrated products.
These HPDP products are meant exclusively for R1-native line emission and up to a maximum wavelength of 206 μm. The R1 continuum remains uncalibrated.
The calibration in the R1 order leakage was further compared to correspondent line fluxes extracted from HIFI and SPIRE spectra at 200 μm. As a result of these comparisions, it was determined that it is necessary to multiply all emission-line fluxes measured from these HPDPs by a factor 1.3.