The main purpose of these Highly Processed Data Products (HPDP) is to improve the quality of the PACS JScanam maps of very extended regions. These regions could not be covered by a single PACS observation (scan + cross-scan) and required several pointings. Examples of these kind of maps are those of the Milky Way, the Orion star forming region and the Large and Small Magellanic Clouds.
The PACS Standard Product Generation (SPG) pipeline indeed processed each pointing separately. This leads to two main issues when one tries two combine several SPG maps into a final mosaic:
On top of that, The Large and Small Magellanic Clouds maps constitute a special case. They were not observed using the standard PACS scan + cross-scan configuration, and as a result they did not have JScanam SPG maps in the Herschel Science Archive (HSA).
The first issue is resolved by creating a mask during the data reduction process that keeps track of those spatial regions that were only visited either by the scan or the cross scan. These regions coincide with the noisy borders described above.
In that context two mosaics are then created with exactly the same WCS projection: one using the mask (i.e. it does not contain the noisy border data) and one that uses all the data. The final mosaic is a combination of the two mosaics on a pixel by pixel level. If a given pixel position contains data both in the masked and the unmasked mosaics, the masked mosaic value is used. If there are data only in one of the mosaics (by definition the unmasked mosaic), that value is then used. This effectively removes the noisy data from the overlap regions, still keeping the data from the non-overlapping borders (better noisy data than no data at all).
To take care of the second issue each map is projected using exactly the same WCS projection and one calculates the average difference between the two maps on the overlapping region. This difference is then subtracted from all the pixels of one of the maps to bring the two maps to the same continuum level. This process is applied iteratively when more that two maps were involved.
As an example, take the following maps overlap sequence: A + B + C + D + E. Map C is taken as the reference map. The overlap difference between maps C and D is subtracted to D. Then the overlap difference between the corrected D map and map E is subtracted to E. This brings maps C, D and E to the same continuum level. Finally the difference between map C and B is subtracted to B and the difference between the corrected B map and A is subtracted to A. After all these steps all the maps share the same continuum level with no significant signal jumps.
As a final correction, the region in the mosaic with the lowest continuum level is searched using a square box of typically 50x50 pixels. The median pixel continuum value in that region is calculated and subtracted from all the pixels in the mosaic. As a result, on average the lowest continuum level in the mosaics is always zero. This assumption is of course not necessarily true, and should always be kept in mind.
Due to the large size of some the maps (LMC, SMC and Virgo), we had to process them following a tiling strategy, each tile being reduced separately. At the end all the tiles were aligned and merged to create the final HPDP maps.
The scripts used to generate these products (in HIPE) are provided in the scripts directory. They are organised following the same structure used for the products, as indeed different processing methods were applied for different use cases. On top of that, a dedicated sub-directory provides scripts in order to combine Galactic plane tiles optimally with the Swarp program
The obsid selection was performed using the ESASky application to find overlapping PACS parallel maps over the whole sky area. In the end, only parallel mode observations were selected 1) in order to limit the total number of maps to combine to a low number, 2) to avoid mixing maps with significantly different PSFs, and 3) because most of the extended regions were observed in parallel mode anyway. Users should also be warned that maps taken from OD-1375 onwards (obsid 1342263819 and beyond) suffer from the loss of one matrix (full half of) of the red channel array. This matrix is masked out automatically in the SPG processing and maps will contain holes.
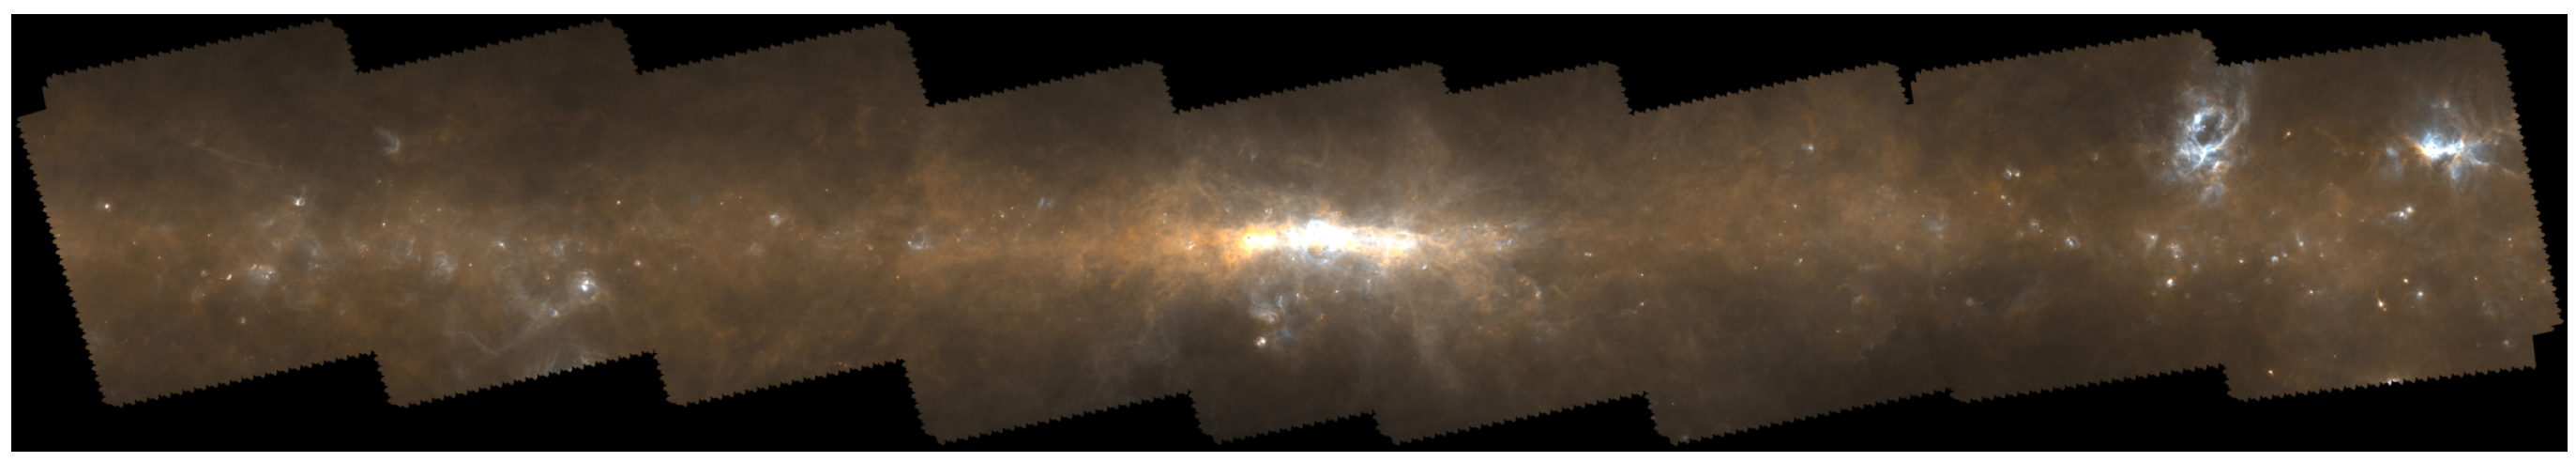
The HPDP is separated in the following parts:Each HPDP comes with a dedicated postcard in the form of an RGB map for the field of interest.
Javier Graciá-Carpio (MPE) and the PACS ICC, 19-April-2017